8. Post processing
Once a regular analysis has been performed, the user is automatically redirected to the results page. The results page is the starting point to handle the analysis results and provide a wide range of features.
8.1. General Information
The General information section is located on the top of the results page and provides useful details on the analysis, like the engine used, the timestep, the Analysis’s degree of complexity (aka doc), etc.
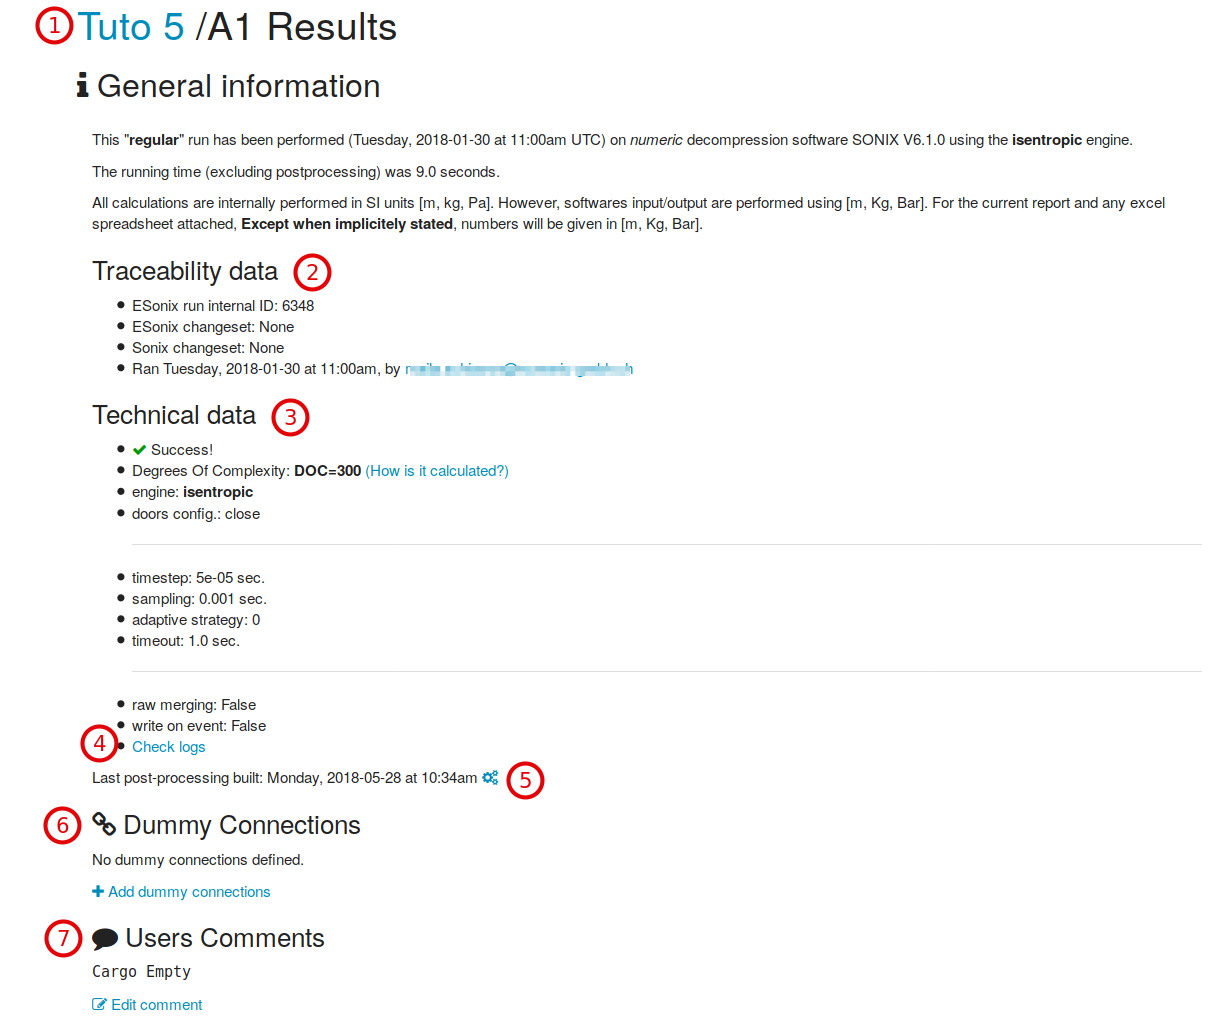
The actions allowed from this section are (numbers refer to Fig. 8.1):
- Shortcut to the Project’s main page
- Traceability data: Esonix internal ID and run’s author Mail address
- Technical data: Details on how was calculated the Analysis doc, engine considered, door position considered, etc
- Shortcut to Analysis logs ( Analysis logs )
- Relaunch postprocess
- Dummy connections summary and creation link ( Dummy Connections )
- Analysis run comments ( User’s Comments )
Analysis logs
Logs are an essential point when checking the analysis. It provides informations about the runs execution and feature several messages tagged as:
- critical
- error
- warning
- info
- debug
The log is filtered by default to print only the “warning” and above messages.
Dummy Connections
When running a cabin, it is frequent that some partitions are completely blind, featuring no connection at all. This means that ESonix has no clue about the existence of such a partition and ESonix will therefore miss an interface.
The user has two strategies as a workaround:
- [advised] Define a dummy connection in the model itself. This means add a connection with, for example, a vent_area_i_to_j==0. As a result, ESonix will take this interface into account when reducing the envelops, with no effects on real results, since the connection is always closed.
- Define a dummy connection after the analysis is performed. ESonix will be able to reclaculate the new interface’s envelops afterwards. This is however a poor workaround compared to modifying the model, as it would have to be done after each run!
however, if by mistake, the dummy connections has been forgotten from the model itself, it can be convenient to create them from the post processing page.
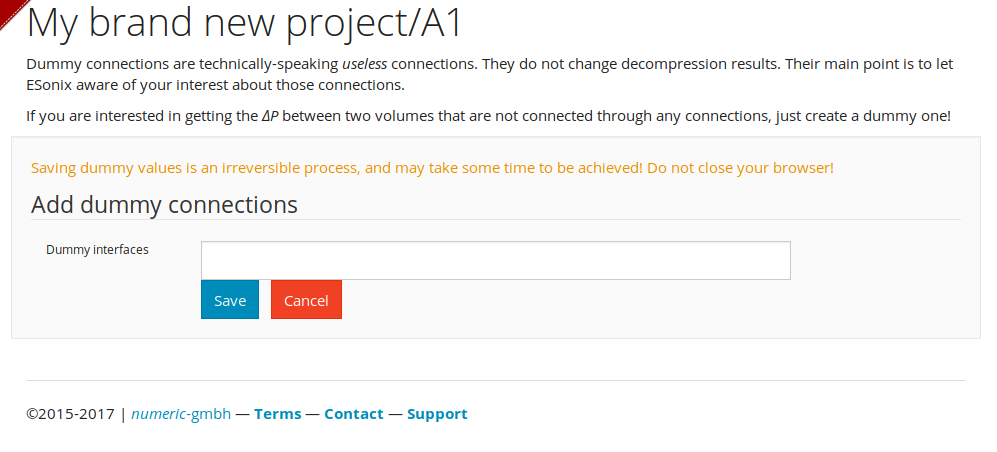
For example, if some blind partitions exist between volumes 1 and 3 and 1 and 4, they can be defined by creating dummy connections like in Fig. 8.2.
The input cell expects a coma-separated list of volumes. If N dummy connections are to be created, 2xN volumes ID need to be input. “1,3,1,4” would therefore define two dummy connections: “1/3” and “1/4”.
User’s Comments
Users comments is a free text allowing the user to store some info about is
run. Comments can be created before the run (cf.
advanced_parameters_paragraph
and new_run_advanced_parameters, item 7). They can be modified
at any moment.
8.2. Downloads
The “Downloads” panel gives access, once unfolded, to spreadsheets deliveries:
- RAW Model spreadsheet (input)
- FILLED Model spreadsheet
- DeltaP envelops spreadsheet
- Events Chronology and summary spreadsheet
Note
For all the spreadsheets, index columns are repeated at the end of the grid to provide an easy way to filter the lines
RAW Model spreadsheet
Spreadsheet uploaded by the user for analysis. Useful for traceability to recover the analysis input data.
FILLED Model spreadsheet
The RAW Model derived spreadsheet, as pre-processed by ESonix. This spreadsheet is useful to check how ESonix has filled the holes during the pre-processing phase.
DeltaP envelops spreadsheet
DeltaP envelops spreadsheet is the main delivery spreadsheet. It provides peaks information in several forms, depending on the tab:
Interface envelop tab
This tab provides an envelop per interface (i.e. throughout all the load case)
The first two columns define the interface:
vol_i: interface’s Volume Ivol_j: interface’s Volume J
The next three columns define the maximum (including negative and positive) peak occuring at the given interface:
lcid_absmax: load case generating the absolute pressure peak for the given interfacepeak_time [sec]: time when absolute pressure peak arisepeak_value [bar or psi]: signed maximum Δp occuring on the interface
Then for each one of “min” and “max”, the same structure is repeated:
lcid_min: load case generating the minimum pressure peak for the given interfacetime of min dP [sec]: time when minimum pressure peak arisemin dP [bar or psi]: minimum Δp occuring on the interfacelcid_max: load case generating the maximum pressure peak for the given interfacetime of max dP [sec]: time when maximum pressure peak arisemax dP [bar or psi]: maximum Δp occuring on the interface
Note
“min” values refer to the Δp from I to J, whereas “max” values refer to the Δp from J to I.
From Fig. 8.4, interface between volumes 1 and 2 (first row) has always a positive pressure pusing from I to J, whatever the load case and time.
Load Case envelop tab
This tab provides an envelop per load case (including all the interfaces).
The same kind of data as Interface envelop tab are provided.
Load cases detailed tabs
Besides per interface and per load case envelops tabs, a detailed peak results is provided per each load case in the next tabs.
Events Chronology and summary spreadsheet
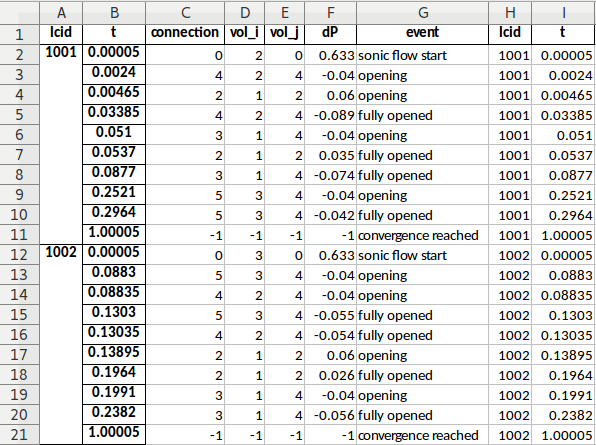
Events spreadsheet provides details on events (decompression features opening, sonic flow, etc.) occurring in the Aircraft during the rapid decompression event.
Two tabs are provided:
Connect Activation Matrix
This tab provides information about events per interface, all load cases included.
The first three columns define the interface:
vol_i: interface’s Volume Ivol_j: interface’s Volume Jid: connection ID as defined in the model spreadsheet
The next two columns give the min and max time at which the connection is activated (i.e. the decompression feature is released)
min_time: minimum time at which the decompression feature is triggeredmax_time: maximum time at which the decompression feature is triggered
The next column counts the number of times the feature is activated.
#LC active: number of load cases where the feature is activated.
Note
A “0” in the #LC active column would mean that the feature is
never activated during the simulations, and therefore probably
useless.
The next N columns (where N is the number of load cases) provide the time at which the decompression feature is activated.
time/LC<lcid>: Time at which the decompression feature is activated for- load case ID <lcid>.
The last columns provide as ever a duplicate index to facilitate filtering.
8.3. Overview panels
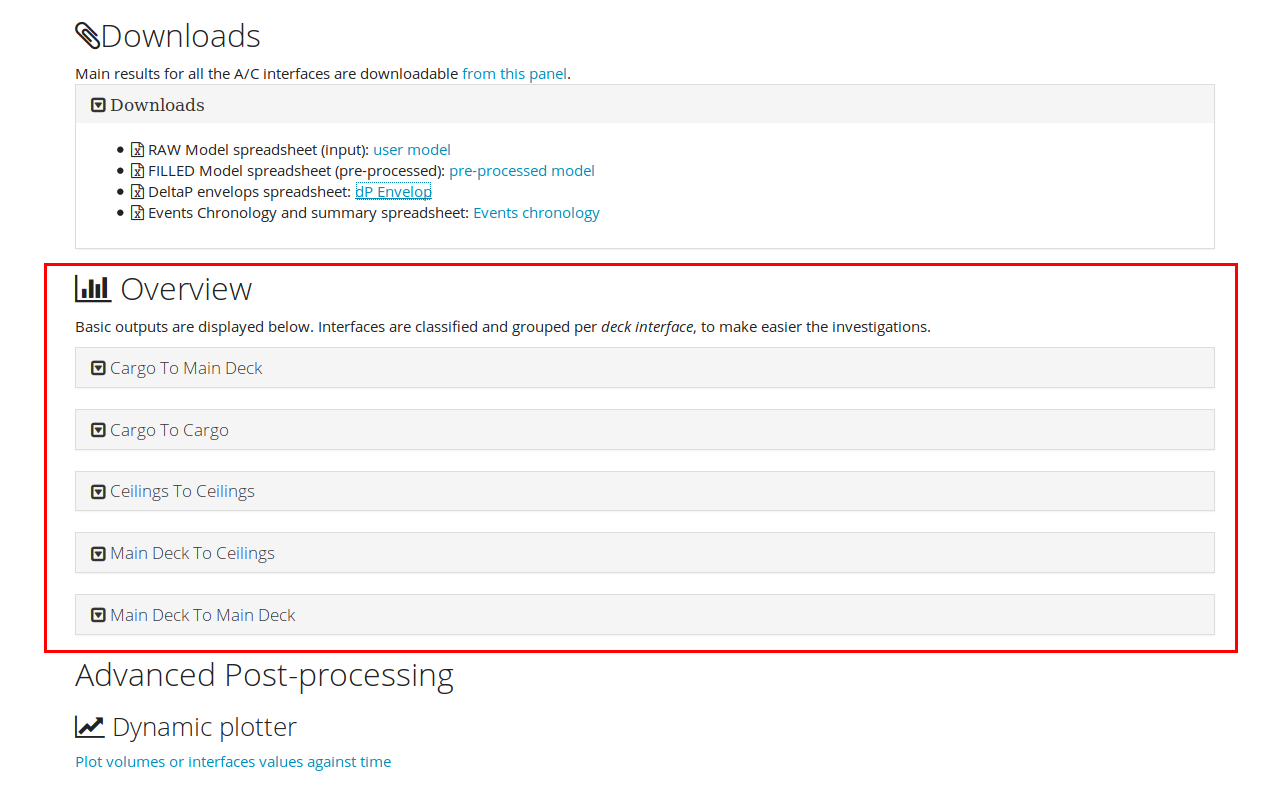
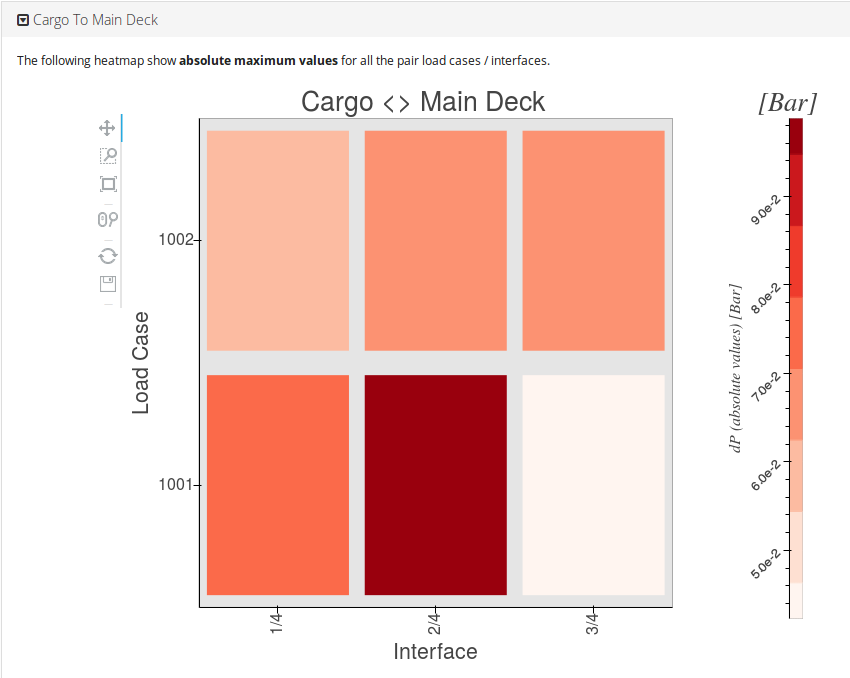
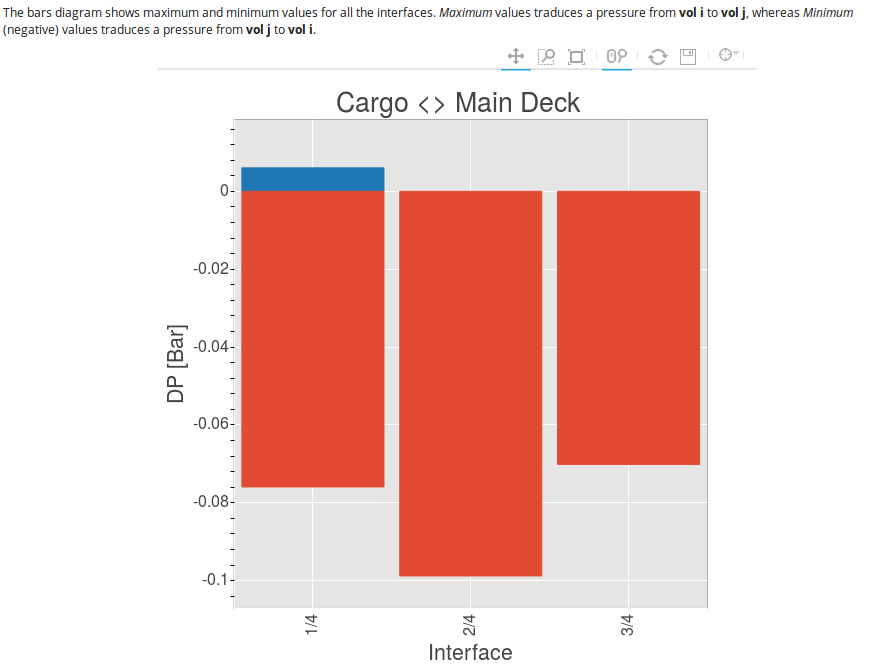
This section provides dynamical overview about the simulation’s results. Based on the “deck” parameter provided in the model (cf. deck), ESonix organise results per deck interface, for example cargo to cargo, cargo to main deck, etc.
Therefore, per deck interface are plotted:
- the deck interface heatmap
- the deck interface histogram
The deck interface heatmap
The heatmap (as shown in example pp_heatmap) provides a fast
overview about the Δp for each interface (X axis) and all load cases (Y axis).
The Deck Interface Histogram
The Deck Interface histogram plot per interface (X-axis) the max (i to j– in blue) and min (j to i – in red) Δp calculated throughout all the load cases.
It is a convenient way for the engineer to check which Δp is to be taken into account for its partition, providing additionally some more details about the direction.
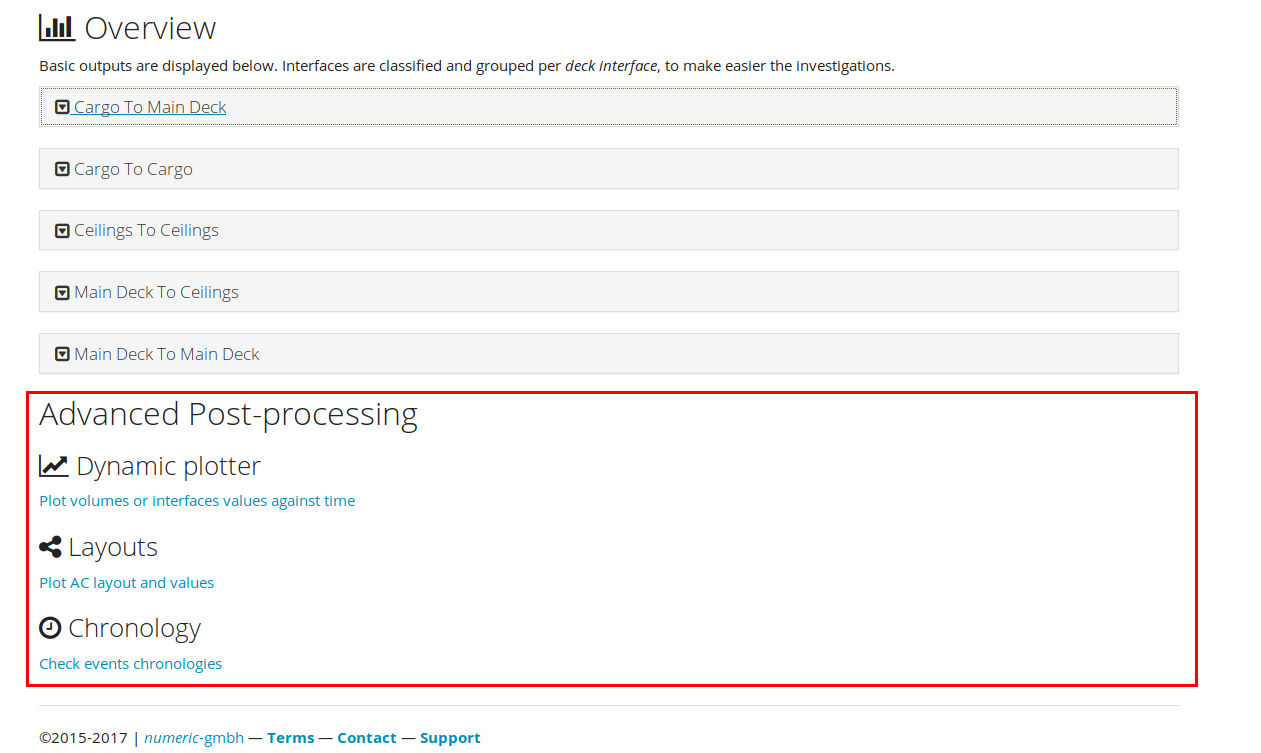
8.4. Advanced post-processing
The advanced post-processing Section provides dynamical online tools for deep investigation of the decompression phenomena. It is the section to be familiar with when dealing with optimisation, or solving some major unsustainable Δp.
Three tools are offered:
Dynamic Plotter
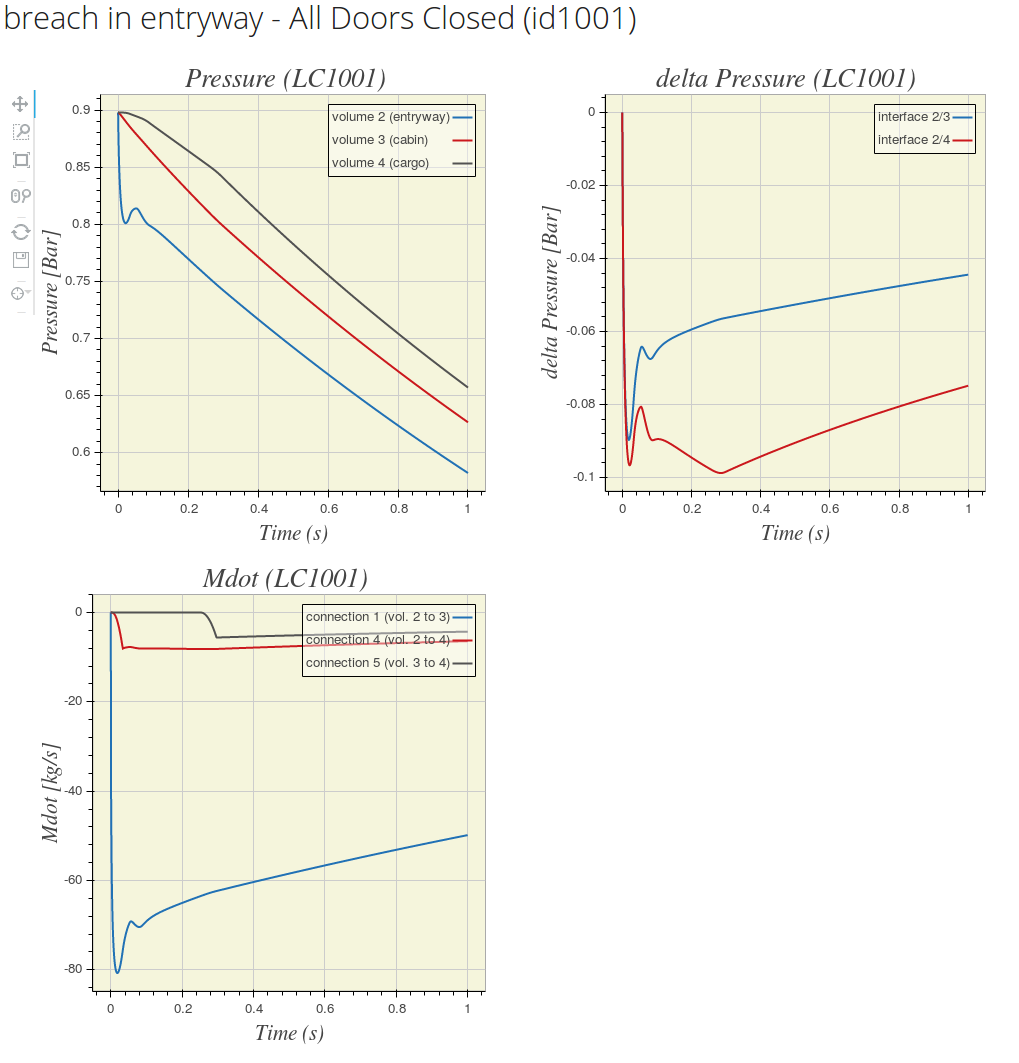
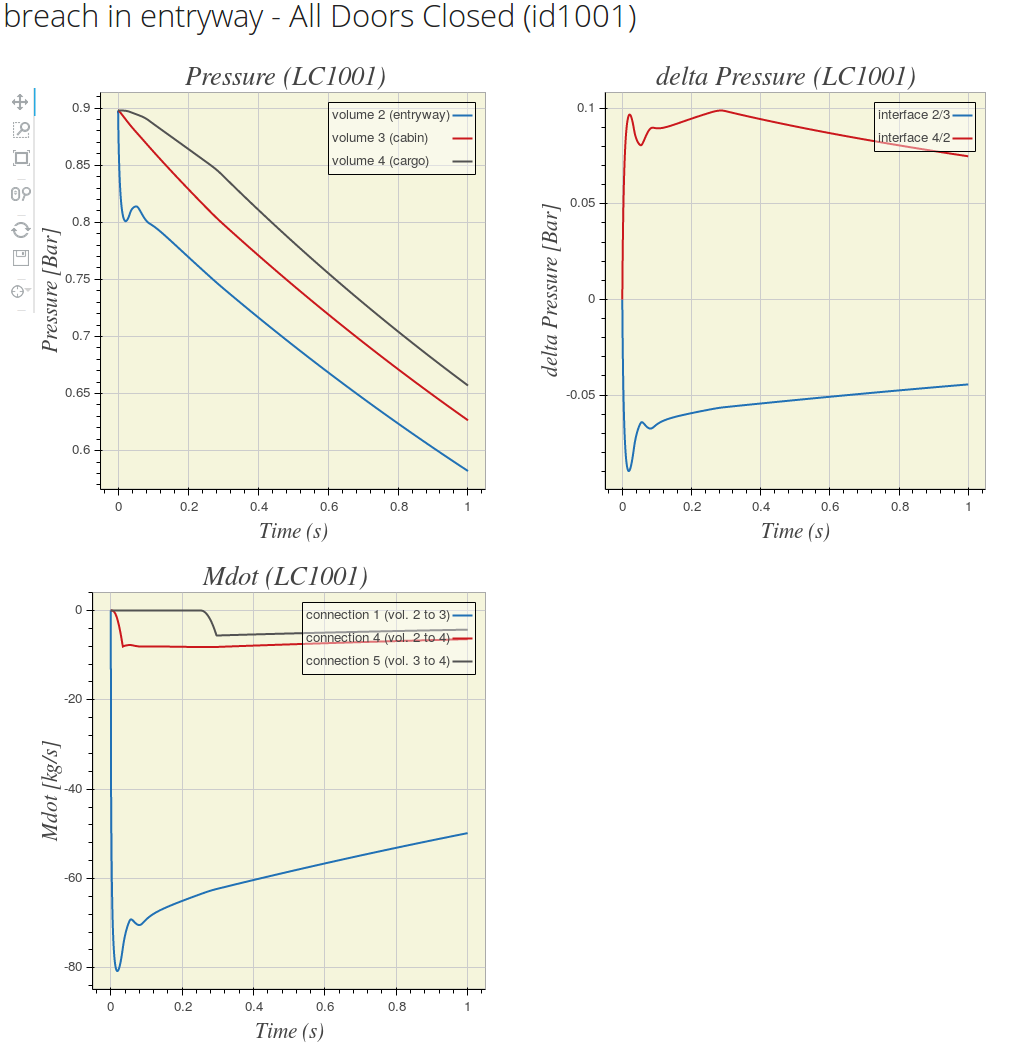
The dynamic plotter plots volume, interfaces and connections data over time.
You can select from the top form (Fig. 8.12):
- Load case to plot
- Volumes as a coma separated sequence of interest
- Data to plot
Note
if the number of volumes to plots is uneven and Interfaces data is selected the following error message will occur “Plotting data from interface requires a single volume OR an even number of volumes” as the Interfaces data is based on a pair of volumes.
Variables available to plot are:
- \(P\) (Pressure) by volume
- \(T\) (Temperature) by volume
- \(\rho\) (Volumic mass) by volume
- \(\Delta_P\) (Pressure differential) by interface
- \(\dot{m}\) (Massflow) by connection
- \(U\) (Celerity) by connection
- \(A\) (Vent area) by connection
- \(\theta\) (Flap opening angle or distance) by connection
For example, selecting “2,3,2,4” as shown in Fig. 8.12, and selecting Δp, pressures and massflows as values to plot would generate three plots (one per variable):
- Pressures for volumes 2, 3 and 4
- Δp for interfaces 2/3 and 2/4
- massflows (\(\dot{m}\))for all the connections connecting volumes 2, 3 and 4
As an example, by comparison, selecting “2,3,4,2” (as opposition to “2,3,2,4” plotted in example Fig. 8.12) would invert (symmetrize) Δp for interface 2/4
8.5. Combination Analysis
All the tools available for regular runs are available for Combination Analysis (cf. Combination Analysis), including sensitivity capacities.
Tip
It needs to be kept in mind that Combination Analysis load cases result from a load case mapping of the combined nodes as illustrated Table 6.1).
8.6. Sensitivity analysis
DeltaP spreadsheet features:
Load cases envelop
For each load case of the reference node results, max Δp and the relevant interface are identified.
For each one of the nodes used to calculate sensitivity, Δp are retrived for the reference critical interface found previously. Statistics are therefore based on those Δp’s.
